
The Largest Ancestry groups in the United States, by state and by county, based on Census 2000 data, from: http://www.usa.org/demographics/
This is an oldie but goodie (from 2006), and I found this very interesting – a map of the United States, by county (and also shown by state in the upper right of the layout) identifying the largest ancestry group for the population in each. When you look at the map by state, it is amazing how many states have German as their largest ancestry group. It’s no wonder that at one time German was seriously being considered as a primary language instead of or in addition to English - this would have been between the late 18th century through the early 20th century, but prior to WWI, when German became verboten since the U.S. was fighting them in the war. Although this is often thought of as a legend or myth, (see http://www.watzmann.net/scg/german-by-one-vote.html) it is true that in certain places (like New York City, St. Louis, Cincinnati, and much of Pennsylvania) there was probably more German spoken at home, in the streets, in the workplaces, and in the churches than anything else. I suspect, looking at this map, that it was the same story in some of the Midwestern states. The Midwest also has some smaller pockets of predominantly Norwegian, Dutch, and Finnish ancestry. However, as was the case with many later immigrant groups from Europe, people tried to assimilate and fit in, and oftentimes jettisoned their native languages in favor of English so as not to appear any more foreign than they had to, and so that they would not be considered outsiders. Often immigrants would purposely not teach their children the language of their homeland, preferring the children to only speak English, so they would have an easier time in school, getting jobs, and finding better places to live. There was a lot of prejudice against foreigners in the U.S. (some things never change).
I find the counties (mainly in the southeastern states) identified as having “American” ancestry to be thought-provoking. What could that mean? We all came from somewhere else, except the Native American Indians (who also came from somewhere else, but a very long time ago). Does this mean they (the self-identified “Americans”) don’t know where their ancestors came from? Or they feel they have been here so long they are entitled to say their ancestry is all “American”? Or that they are so multi-culti that they couldn’t pick just one national/ethnic group as their ancestors? I would have thought this later problem would have occurred most often in big city “melting pots” not in relatively homogenous rural mountain areas. Some of the readers’ comments on this topic on the website include the following: “I guess 5 generations of hillbilly isn’t a listed checkbox” (mean and snarky!) and “I believe ‘American’ translates to Scotch-Irish ancestry, as that’s the dominant Caucasian ancestry for pretty much all of those areas covered by the label.” Yes, I think that many people don’t think of themselves as having any ethnicity other than American when their ancestors have been here for a few hundred years.
Also, the census allows you to check off more than one box for ancestry (this info was collected on the long form in 2000, in other words it is a sample of the total population, but now I’m not sure how it works since they did away with the long form in the 2010 census), so some of this maybe double-counting ancestries. In any event, according to the 2000 census, about 1 in 6 Americans list their ancestry as “German,” making it the largest ancestry group in the U.S. However, there are nay-sayers, who argue that if you combine all the British groups (English, Irish, Scots, Scots-Irish, Welsh, Canadian (?), etc.,) and the people who ARE of that heritage checked that off instead of “American,” British would be the largest ancestry group. I think this whole thing is pretty tricky, many Americans don’t really know where their ancestors are from, or they just don’t think about it in those terms, and also you realize that you hardly ever meet anyone who tells you their ancestry is “English” or “British,” especially when their ancestors have been here since colonial days. (Unless they belong to the Daughters of the American Revolution or descended from the Mayflower pilgrims or something equally high falutin. Or unless they are immigrants from the UK themselves, or first generation with parent(s) from the UK.)
Now, if you look at New York State, although there are many counties identified as having German, Irish, or English (and French in the New York State counties bordering French Canada) as their dominant ancestry, when you look at it on the state version of the map, Italian is the dominant ancestor group. This is true of New Jersey, too, I guess no big surprise there, as anybody who has watched Jersey Shore can attest (only kidding! No hate mail please! I love NJ!)

And now, for a REAL oldie but goodie, Charles Joseph Minard’s “Carte figurative et approximatative represéntant pour l’année 1858 les émigrants due globe,” or a flow map of immigration around the world. From the American Memory site http://memory.loc.gov
This is another wonderful example of data visualization by Monsieur Minard, he of the seminal graphic depiction of Napoleon’s Russian Campaign of 1812, a graph/map that charts the course and attrition rate during Napoleon’s doomed march on Russia – well known to all Edward Tufte devotées (“The Visual Display of Quantitative Information”). This map of global immigration was produced in 1862, and rather ingeniously synopsizes the primary routes of migration in 1858. I tried to find a higher resolution version, but was unsuccessful. Nevertheless, by zooming in on this one, it is possible to decipher most of the legend, which is in French, and also somewhat confusingly vacillates between naming the countries of origin of the immigrants or the ports they departed from.
So, from the Legend's top, the green is from “England,” (strangely enough, Ireland is not shown, even though in 1858 it would seem that many of the British immigrants were still coming from Ireland in the wake of the great famine. Most of the English in 1858 were headed toward the Unites States, Canada, but mostly to Australia); the pink is from “Hamburg and Bremen” (these are the major German ports immigrants departed from in Germany, cities in the old Hanseatic League. In 1858, when this map was made, this was prior to the unification of Germany, so these numbers of immigrants might include those from other parts of what is now or was then Germany, such as Prussia, Pomerania, Bavaria, Saxony, etc., other neighboring European countries such as Poland, and some of the Scandinavian countries, such as Denmark, as shown by the narrower pink line); teal lines denoted immigrants from France (notice the line linking France to Algeria); grey lines were immigrants from Portugal (going mainly to Brasil, as were some French and Germans); Brown were immigrants from Africa (at this time there was only a relatively small amount of illegal slave trade to most of the Americas, the trade from Africa having been outlawed in 1808 in the US, and 1807 in England and her colonies, [this outlawed the importation of enslaved people, not the institution of slavery itself, which obviously continued apace in the US and other countries for decades longer], but notice still a line linking west central Africa to Jamaica and Trinidad. This may have been the people from the Congo who went to these Caribbean outposts of England as indentured servants, more like serfs than slaves, but they were voluntary immigrants. The thickest line from Africa in 1858 led to the Indian Ocean Islands off the coast of Africa – the islands of Reunion and Mauritius, French colonies); Yellow designates Chinese immigrants (headed towards the west coast of the US where they built the railroads and participated in the gold rush activities, but they also went in numbers to Australia and the Caribbean); and tan were immigrants from India (notice how the lines from India go to the Anglophone Caribbean and British Guyana, in part to make up for the nearly complete stoppage in the trans-Atlantic slave trade from Africa, and the actual emancipation of slaves in many Caribbean islands by the 1830's. The Indians came as indentured servants, for the most part, to work the plantations and assume other labors formerly performed by African slaves).
It’s difficult to see, but the lines have numbers written on them, indicating the numbers of immigrants. 1858 was prior to the great migration to the US from eastern and southern Europe and from Russia, which happened later in the 19th and early 20th centuries. All in all, a fascinating snapshot of immigration in mid-19th century, a time of great political upheaval and social unrest in the world, and at the height of industrialization and all its attendant evils. Of course, it’s a very coarse snapshot, and much detail and nuance is omitted, but nevertheless a pretty good effort, considering the paucity of data that Minard likely had at his disposal back then. A comprehensive bibliography of the graphic works of Charles Joseph Minard can be viewed at http://www.datavis.ca/gallery/minbib.php

While we are on the subject of immigration, here is something a bit more recent, a map of the status of immigration laws in the United States.
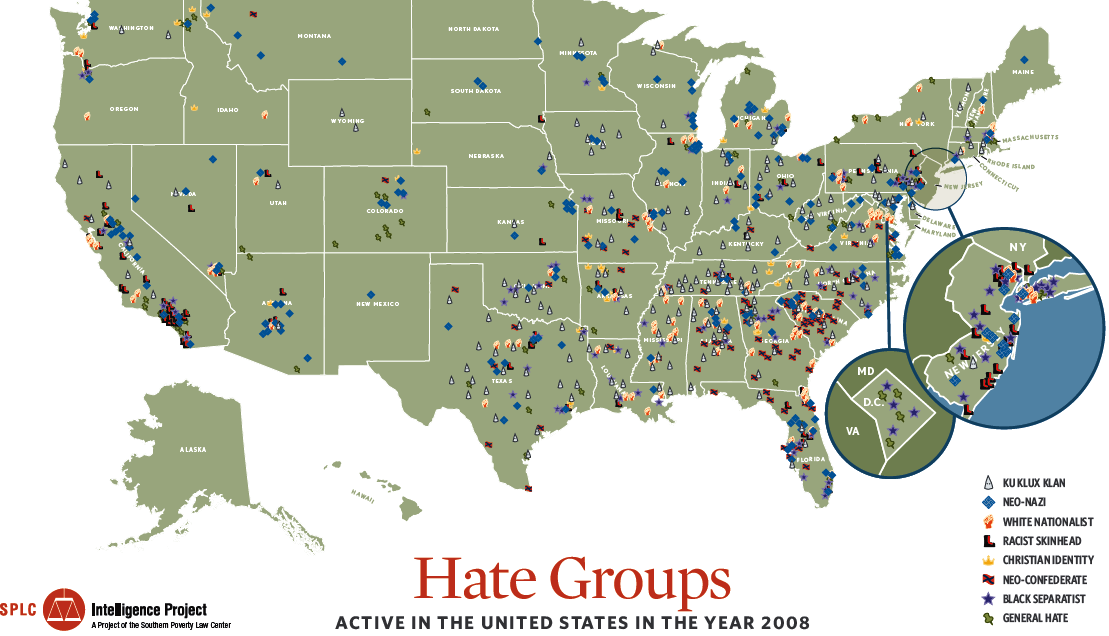
And just to round it out, since talk of immigrants and immigration (at least in the U.S., but I think unfortunately in many other countries, as well) comes back around to hatred and intolerance, here is a map of Hate Group locations in the U.S. (Please ignore the weird projection.)
See: http://geographer-at-large.blogspot.com/2012/02/tracking-y-chromosomes-through-time.html for more immigration/migration mapping.
See: http://geographer-at-large.blogspot.com/2012/02/tracking-y-chromosomes-through-time.html for more immigration/migration mapping.
Technically, didn't the human race originate in Africa? Racial hate groups are rather ignorant.
ReplyDeleteGreetings, and thanks for your comment. I agree that the best scientific evidence we have points to an East African origin for all humankind. There has been not only forensic/fossil/archaeological evidence, but also solid research on genetic markers showing us our origins. Reasonable and well-informed people do not doubt this any longer. Your second statement that members of hate groups are “rather ignorant” is putting it mildly! I think they are a great deal more than “rather” ignorant, and they are also extremely dangerous to the rest of us.
DeleteUnfortunately, just showing people facts and evidence does not ensure that it will be believed, as witnessed by many current scientific debates right now, such as global climate change. Heck, a lot of these people don’t even believe in evolution, or the vast age of the Earth, and they maybe only just got around to believing that the Earth is not flat and the sun doesn’t revolve around the Earth! Some still think that man was created in the Garden of Eden in the middle east and woman was fashioned from the first man’s rib, and that the creation of the world can be precisely identified as having occurred 6,000 years ago, based on a calculation of all the begetting and begatting in the Old Testament of the Judeo-Christian Bible! Many of these people think it is against Church doctrine to believe in evolution – they staunchly deny and are offended by the idea that humans are descended from monkeys, even though of course the principles of evolution have never claimed any such thing. So to get these people to understand that we (humans) all belong to the same species, and that race is a societal construct is probably asking too much at this time. In any event, acknowledging the origins of something doesn't necessarily mean you don't end up hating it, despite the knowledge. Didn't Christianity originate out of Judaism? Wasn't Jesus a Jew? Didn't Islam have strong links with both Judaism and Christianity? Aren't Jesus, Abraham, and Moses prophets in the Qur'an? Did this ever stop Muslims, Christians, and Jews from holding the other groups in contempt?
For some odd reason, some people feel the need to hate. It doesn’t necessarily involve race (although it usually does), and it oftentimes extends to hatred of foreigners, immigrants, people of other religions, other sexual identities, different lifestyles, different political views, you name it. And then there is the big one - hatred of women. There are whole areas of the world where women are suppressed in every imaginable way (and in some unimaginable ones) and sex is used as a weapon against them. I have added another map to the blog posting that shows our exodus out of Africa, based on genetic markers. I think it is an important addition to a post about ancestry and immigration, so thanks for spurring me to add it. For the new maps, see http://geographer-at-large.blogspot.com/2012/02/tracking-y-chromosomes-through-time.html
just found your blog.
ReplyDeletesuper love it, i love your style ♥
you are pretty,i love the way you dressed up.
mind to follow each other?
crime scene management