
“This work by
the German cartographer Martin Waldseemuller is considered the most expensive
map in the world because, as Brotton notes, it is "America's birth
certificate"—a distinction that prompted the Library of Congress to buy it from a German prince for $10 million. It is the first map to recognize
the Pacific Ocean and the separate continent of "America," which
Waldseemuller named in honor of the then-still-living Amerigo Vespucci, who
identified the Americas as a distinct landmass (Vespucci and Ptolemy appear at
the top of the map). The map consists of
12 woodcuts and incorporates many of the latest discoveries by European
explorers (you get the sense that the woodcutter was asked at the last minute
to make room for the Cape of Good Hope). ‘This is the moment when the world
goes bang, and all these discoveries are made over a short period of time,’
Brotton says.”
(See also http://geographer-at-large.blogspot.com/2011/05/geography-beach-books.html for a discussion of The Fourth Part of the World: The Race to the Ends of the Earth, and
the Epic Story of the Map that Gave America its Name, a book about
the Waldseemuller map and its importance, as well as http://geographer-at-large.blogspot.com/2013/03/the-globemakers-toolbox.html about The Globemaker’s Toolbox, another recent book about the map.
When I
mentioned this website from The Atlantic,
“12 Maps that Changed the World,” to some friends (non-map people), they were
rather astonished. They had a hard time
grasping the concept that maps could change the world, or even be very
important to our lives in any way. Check
out this (article from The Atlantic) at
http://m.theatlantic.com/international/archive/2013/12/12-maps-that-changed-the-world/282666/?google_editors_picks=true NOTE: Best viewed in Chrome; Internet Explorer seems to distort
the images, for some odd reason. Thanks, Christopher
Herrmann, for sending me the link.
I would
agree with most of their picks - who could dispute the importance of maps by
Ptolmey, Al-Idrisi, the T-in-O Mappa Mundi, Waldseemuller, Mercator, the
Gall-Peters projection, and so forth - although a couple of their top 12 seem
rather removed from global significance, to my mind, but nevertheless they are
all fabulous maps/mapping efforts. My
list would probably be a bit different, and I don’t think I would be able to
pick just 12! (I have a problem
restricting myself!) I might have added
in or substituted the following 12 maps (in no particular order of importance):
1.
John Snow’s 1854
map of cholera cases in mid-19th century London, which was one of
the most significant jump starts to medical geography/spatial analysis, and the
discovery/evidence of the links between disease and environment (see my blog
post http://geographer-at-large.blogspot.com/2013/03/cartographies-of-life-and-death-john.html on John Snow’s map).

John Snow’s map, pinpointing
cholera deaths and the location of public water pumps in Soho, London.
2.
The US Public
Land Survey System (PLSS), begun in about 1785 at Thomas Jefferson’s behest, which
platted townships and sections in most of what is now the United States, and
which basically laid an imaginary grid over the whole country in the spirit of
the rational age of the Founding Fathers.
The PLSS shaped the landscape of the entire continental US (outside of
the original 13 colonies and a few other earlier-settled eastern states);

1885 Township platting of Kent,
Ohio
3.
The UK
Ordnance Survey (definitely!) which was extremely influential and innovative,
and set the standard for many national mapping programs (including the massive
effort of mapping the Indian subcontinent), and introduced many ground-breaking
surveying and cartographic techniques.
The OS maps are still vitally important today, and many visitors to the
UK who use the maps marvel at the extreme detail and the very large scale –
some series are 6 inches to the mile! See http://geographer-at-large.blogspot.com/2011/08/map-addict.html

Detail of an Ordnance Survey map
in the UK, the original impetus of which was military defense and intelligence
gathering. The village of Wooten Bridge,
surveyed in 1862.
4.
On a more
localized level, in terms of impact, the maps resulting from the surveyor’s
mapping of the Mason-Dixon Line between north and south U.S., with its very
real ramifications on people’s lives in the 19th and even 20th
centuries. The Mason-Dixon line was
surveyed in 1763-1767 in response to a border dispute between some of the American
colonies prior to the Revolutionary War.
It has become understood in the conventional wisdom to symbolize a
cultural boundary between the northern and southern states, and also served (unintentionally)
as a rough line of demarcation separating slave-holding states from states
where slavery was illegal. This line was
unofficially extended out as the country grew westerly, and the subsequent maps
that resulted depicted the country divided into slave and non-slave states, as
famously seen in the Abraham Lincoln painting of signing the Emacipation
Proclamation; http://www.finebooksmagazine.com/issue/1104/mason-dixon-2.phtml

The map prepared by the surveyors
Mason and Dixon, on behalf of the Royal Astronomical Society in Greenwich, UK,
using some instrumentation and methods not readily available to colonial
surveyors, which increased the accuracy of the survey.

Lincoln signing the Emancipation
Proclamation, featuring the map showing the country divided into slave and
non-slave states. The map appears at the
bottom right corner of the painting, and was made by the U.S. Coast Survey in
1861 using census data from 1860, and shows the relative prevalence of slavery
in Southern counties that year. The painting is now hanging in the U.S. Capitol Building.
5.
The 1811
Commissioner’s Plan for the proposed gridiron layout of NYC, which more or less
created the real estate frenzy that continues to define New York City, not to
mention the uniquely simple and topography-erasing street pattern of Manhattan,
which persists to this day. The grid
plan for NYC was in keeping with the US PLSS, and influenced many cities to
adopt the rationality and ease of wayfinding of the grid, thus rejecting the
more organic form that most European cities had as an artifact of the mediaeval
era.

The 1811 Commissioners’ Grid Plan
for Manhattan
6.
The map that
al-Hassan ibn-Muhammad al-Wezaz
al-Fasi (aka Leo Africanus) prepared for Pope Leo X in about 1520, based
on geographical knowledge from of Leo Africanus’s own extensive travels, and
which showed as never before to Western eyes the reality of northern Africa and
the Middle East. See http://geographer-at-large.blogspot.com/2011/04/leo-africanus-15th-century-geographer.html

A detail of the 1520 Leo
Africanus map, derived and compiled from a collection of maps Leo was traveling
with when he was captured by pirates in the Mediterranean Sea. These maps helped save Leo’s life from the
pirates, since he had no one to ransom him, and so was otherwise worthless to
them, but he did have the maps, which the pirates recognized as valuable. They sold Leo Africanus (and the maps) to the
Pope as a slave.
7.
In that
vein, I would also have to include The
Catalan Atlas, 1375, by
the Jewish cartographer Abraham Cresques of Majorca, Spain, which was partially
a type of Portolan navigational chart, a cutting-edge and more accurate
technique at that time, and the map was also considered to be the most complete
picture of geographical knowledge as it stood in the later Middle Ages. See: http://geographer-at-large.blogspot.com/2011/04/rediscovering-african-geographies.html

Detail
of the 1375 Catalan Atlas
8.
Speaking of Africa, how could we neglect to mention the
famous Berlin Conference of 1884-1885 (also known as the Congo Conference) where
Africa was divided up on a map amongst all the major European powers of the
day. That dividing-up map still
reverberates today with the borders of countries having nothing to do with
tribal areas, language or cultural groups of the indigenous peoples, dividing
people who should have been kept together, and putting together people who
didn’t want to be together, and based solely on “equitably” spreading out the
“spoils” of African resources amongst the European colonials who had footholds
in various parts of Africa by then. Many
consider this map to be the un-doing of Africa.
See http://geographer-at-large.blogspot.com/2011/04/rediscovering-african-geographies.html

The Partition of Africa - The Berlin Conference Map of 1885
9.
The 1602 Matteo
Ricci map of the world. Ricci was a
Jesuit priest who traveled as a missionary to China in 1583. In
1602, Ricci and his Chinese collaborators created the first map of the world in
Chinese, now called “The Impossible Black Tulip of Cartography,” because of its
rarity, importance, and exoticism. Its name in Chinese is Kūnyú Wànguó Quántú;
literally “A Map of the Myriad Countries of the World”; in Italian, “Carta Geografica Completa di tutti i Regni del Mondo;”
or “Complete Geographical Map of all the Kingdoms of the World,” printed in
China at the request of the Chinese Emperor.

This is a
later variation of Ricci's map. The original 1602 Ricci map is a very large, 5 ft (1.52 m)
high and 12 ft (3.66 m) wide, xylograph of a pseudocylindrical map projection,
showing China at the center of the known world. Its projection is similar
to the 1906 Eckert IV map. It is the first map in Chinese to show the
Americas. It was originally carved on six large blocks of wood and then
printed in brownish ink on six mulberry paper panels, similar to the making of
a folding screen. See: http://geographer-at-large.blogspot.com/2011/06/method-of-loci-memory-palace.html
10.
Olaus Magnus’s 1539 Carta Marina
– a map of the ocean showing the Northern Lands. See http://geographer-at-large.blogspot.com/2012/04/motw-4-23-2012ultima-thule.html It is a very large map, about 5 ½ feet wide by 4
feet high. “Magnus' map of the great northland was a fantastic
achievement, its stature undeterred by the liberal use of sea monsters and
other fanciful creatures. The detail in the coastlines (as well as the
depiction of currents between Iceland and the Faroe Islands) as well as
interior features make these among the most detailed maps of the north yet
printed in the 16th century.”

Detail of the 1539 Carta Marina,
showing the northern islands of Scotland/Norway/Iceland (Orkneys, Faroe, Shetland).
11.
Joseph
Minard’s 1869 flow map showing a detailed and longitudinal view of Napoleon’s
1812 march into Russia, which ended so disastrously for the French
troops. There are a number of variables
portrayed in this 2-dimensional figure, which very beautifully conveys a
complex set of information, according to the wiki entry for Minard:
§ the size of the army - providing
a strong visual representation of human suffering, e.g. the sudden decrease of
the army's size at the crossing of the Berezina
river on the
retreat;
§ the geographical co-ordinates,
latitude and longitude, of the army as it moved;
§ the direction that the army was
traveling, both in advance and in retreat, showing where units split off and
rejoined;
§ the location of the army with
respect to certain dates; and
§ the weather temperature along the
path of the retreat, in another strong visualisation of events (during the
retreat "one of the worst winters in recent memory set in").
Étienne-Jules
Marey first
called notice to this dramatic depiction of the fate of Napoleon's army in the
Russian campaign, saying it "defies the pen of the historian in its brutal
eloquence"[ Edward Tufte says it "may well be the
best statistical graphic ever drawn" and uses it as a prime example
in The Visual Display of Quantitative Information.
Howard Wainer identified Minard's map as a
"gem" of information graphics, nominating it as the "World's
Champion Graph
Minard was a
pioneering cartographic and graphic designer, creating some of the first maps
using pie graphs and other then-novel ways of mapping data.

Minard’s flow map/diagram of
Napoleon’s 1812-1813 march into Russia.
12.
The Blue
Marble satellite image of Earth - In
some ways, these “pictures” of the whole earth from space have been
instrumental in revising the average human’s mindset about our puny and tenuous
existence in the universe, promoting the opposite of a geo-centric outlook,
while at the same time reminding us earth-dwellers of our possibly unique place
in the scheme of things and how fragile our planet actually is. “This NASA moving image, recorded by
satellite over a full year as part of their Blue Marble Project, shows the ebb and flow of the
seasons and vegetation. Both are absolutely crucial factors in every facet of
human existence -- so crucial we barely even think about them. It's also a
reminder that the Earth is, for all its political and social and religious
divisions, still unified by the natural phenomena that make everything else
possible.”

The Blue Marble satellite image
of Earth
Worthy Runners-Up:
A.
Charles
Booth’s 19th century Poverty Maps of London, perhaps the first thematic maps with extensive use of socio-economic mapping, and his exhaustive ground-truthing
methods of information gathering.

B.
Danny
Dorling and teams’ Worldmapper Atlas of global conditions, using his amazingly
effective and innovative cartogram technique.
For more of
Dorling’s work, see:

World Population by Country
C.
Baron
Alexander Von Humboldt’s isotherm map of temperature. He developed the first isotherm maps as well
as some other interesting new ways of geo-visualizing natural data in
2-dimensions. He focused mainly on the
New World, and was an inveterate traveler, being in many cases the first person
mapping areas in South America and other parts of “The Kingdom of New Spain,”
including Mexico, Texas, and parts of what is now the American Southwest. He was also possibly the first person to
proclaim that the continent of South America “fit” into the shape of Africa,
and at one time they were probably joined landmasses. There is an important Pacific current named
after him, a cold current from Antarctica that comes up the west coast of South
America and allows penguins to thrive in the Galapagos Islands on the
Equator.

First map of isotherms, showing mean temperature around the world by
latitude and longitude. Recognizing that temperature depends more on latitude
and altitude, a subscripted graph shows the direct relation of temperature on
these two variables
D.
Dr. Robert
Perry’s 1844 maps of fever epidemic as connected with socio-economic and
housing conditions in Glasgow, Scotland. One of the first of its kind, and pre-dates
the influential John Snow cholera maps by a decade, and the Charles Booth
Poverty Maps by 40 years. The map uses local
medical reports, statistical tables and a color-coded map of the city to
highlight the link between poor sanitation, poverty, and poor health. It
is an excellent example of early thematic mapping, and pre-dates both Charles
Booth’s Poverty Maps of London (1886-1903), and John Snow’s cholera maps of
Soho, London (1854). Perry’s map, with different neighborhood areas
colored differently to designate the severity of the epidemic, made it obvious
that the effects of the epidemic were not distributed evenly throughout the
city, but disproportionately affected the poorest, most densely settled areas,
where as many as 20% of the population had succumbed to the disease. See
more on Robert Perry and the 1843 fever epidemic at http://special.lib.gla.ac.uk/exhibns/month/feb2006.html.
Also see http://geographer-at-large.blogspot.com/2012/01/map-of-week-1-9-2012old-glasgow.html

Detail of the Fever Map, showing
fever cases
E.
German
propaganda maps from the 1930’s which helped sway opinion as to the
righteousness of Germany occupying neighboring countries to allow for their
famous “elbow room” to grow the German race and reclaim formerly German
territories.
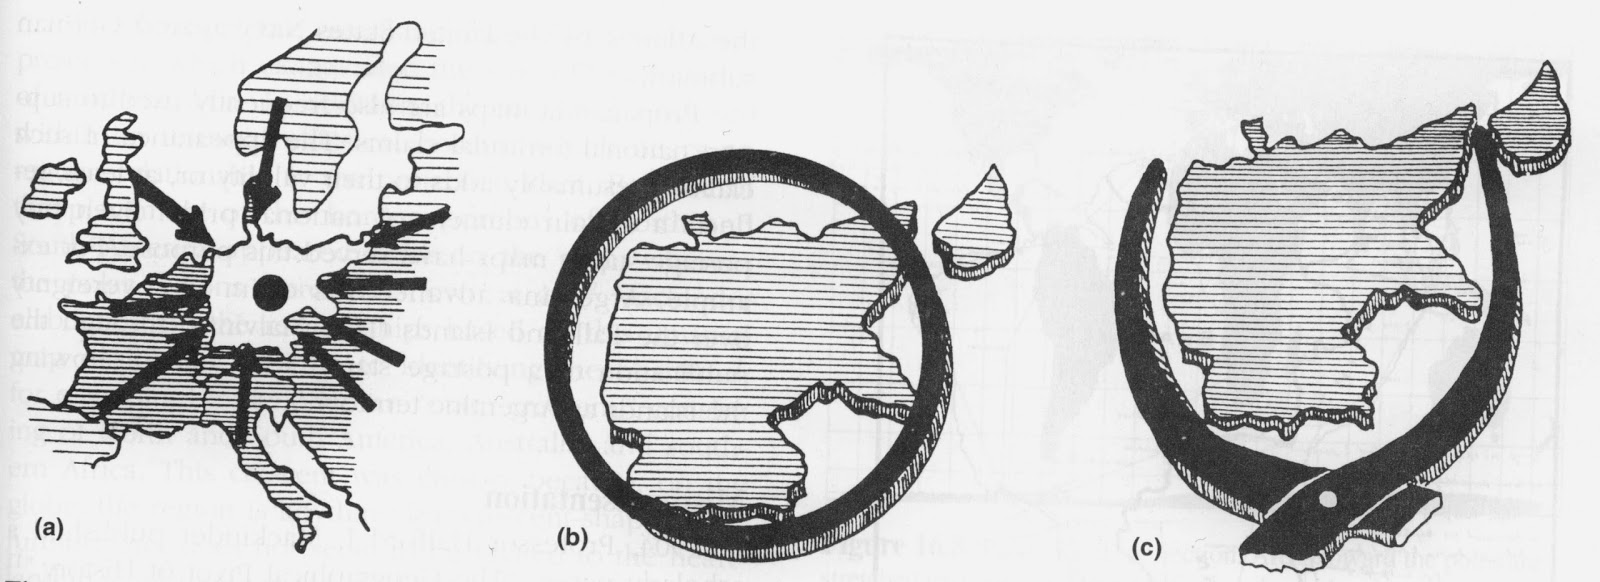
Typical
propaganda map symbols: (a) arrows represent pressure on Germany from all
sides; (b) circle signifies the encirclement of Germany before and after WWI;
(c) pincers personify the pressure against Germany from France and Poland from
the west and east.
Of course,
my list is heavy on the historically significant maps, and unfortunately this
means that I have given short shrift to modern-day cartographers and
geovisualizers, mainly because they haven’t had sufficient time to demonstrate
their importance yet! There are all
kinds of potentially influential maps being produced today, which is, of course, part of what my blog attempts to bring to light.
In 2010, the
British Library had an exhibit on the World’s Greatest Maps. For their picks, see:


